
This analysis is based on the Glass Wall Systems (India) Offer Document dated September 03, 2026. For the educational purpose, IPOStack have evaluated the trust’s structure, assets, and financial projections.
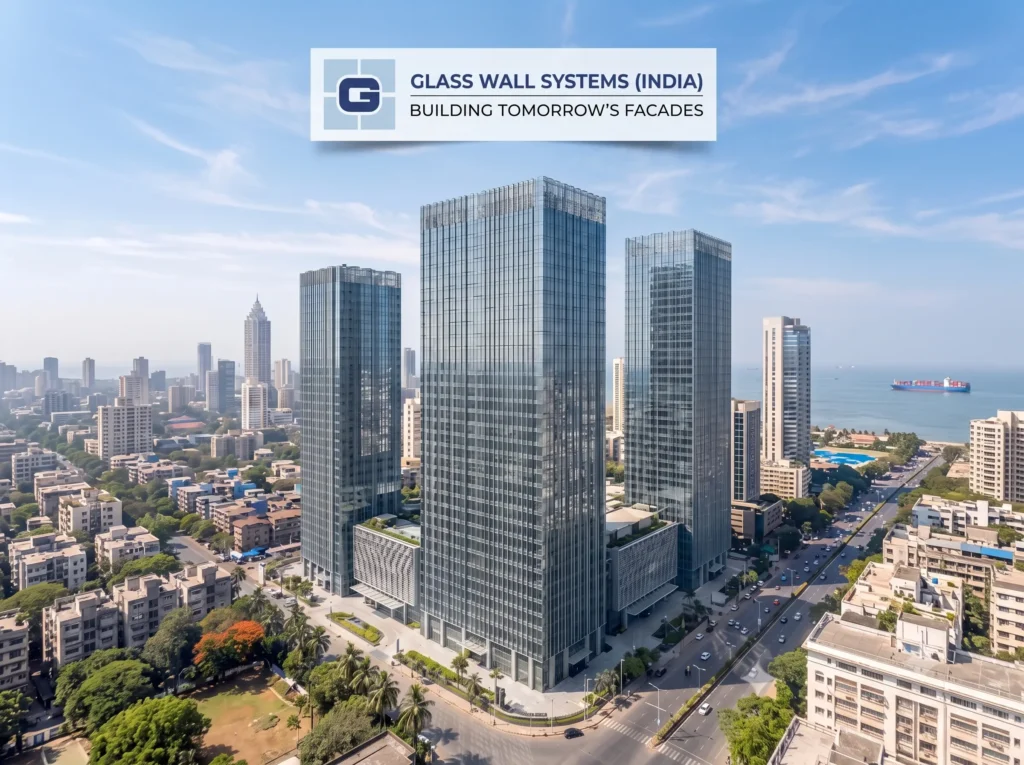
Glass Wall Systems (India) SNAPSHOT
- Company Name & Business Model: Glass Wall Systems (India) Limited is an end-to-end provider of architectural façade engineering solutions, international façade product supplies, and premium fenestration systems. The company operates a fully integrated model encompassing design, engineering, manufacturing/fabrication, project management, and on-site installation across commercial, residential, and institutional real estate developments in India and export markets (predominantly the US and Australia).
- IPO Type & Size:
- Fresh Issue: Up to ₹60.00 crore (₹600.00 million).
- Offer for Sale (OFS): Up to 20,213,722 Equity Shares of face value ₹2 each (~₹367.89 crore at the cap price).
- Total Issue Size: ₹427.89 crore (23,510,425 shares at the cap price).
- Price Band & Issue Details:
- Price Band: ₹172 to ₹182 per equity share.
- Lot Size: 82 Equity Shares (Minimum application amount: ₹14,924 at upper band).
- Issue Dates: Opens on Tuesday, September 8, 2026; Closes on Thursday, September 10, 2026.
- Listing Exchanges: NSE (Designated Stock Exchange) and BSE.
- Market Capitalization: At the upper price band of ₹182 per share (post-issue equity base of ~87,935,253 shares), total market capitalization stands at ~₹1,600.42 crore.
OBJECTS OF THE OFFER of Glass Wall Systems (India):
The Net Proceeds from the Fresh Issue (~₹60.00 crore gross) are earmarked as follows:
- Capital Expenditure (Glass Processing Unit – GPU Project): ₹50.00 crore (₹500.00 million) to establish an in-house glass processing facility as part of planned backward integration at its primary manufacturing facility in Vile Bhagad, Raigad, Maharashtra.
- General Corporate Purposes (GCP): Balance net proceeds, strictly capped at ≤ 25% of Gross Proceeds (~₹10.00 crore or less net of issue expenses).
- Debt Repayment Flag: No fresh issue funds are directed toward debt reduction.
- GCP Proportion Flag: Within SEBI’s 25% statutory limit (compliant).
- Verdict: The Fresh Issue portion directly funds BUILDING internal capacity via critical backward integration (in-house float-glass processing). However, at the aggregate issue level, 85.98% of the proceeds represent an EXIT for private equity (Motilal Oswal’s IBEF IIA) and partial monetization by promoters.
FINANCIAL ANALYSIS (FY24 – FY26) of Glass Wall Systems (India)
| Metric (₹ in million) | FY 2024 | FY 2025 | FY 2026 |
| Revenue from Operations | 3,043.42 | 2,783.27 | 4,569.71 |
| EBITDA | 546.99 | 730.08 | 1,051.98 |
| Restated PAT | 202.51 | 575.10 | 837.89 |
| Diluted EPS (₹) | 1.81 | 6.21 | 9.90 |
| Total Borrowings | 248.53 | 84.64 | 66.82 |
| Total Equity (Net Worth) | 1,209.06 | 1,740.59 | 2,598.84 |
| Cash Flow from Operations (OCF) | 427.22 | 729.53 | 732.50 |
- Revenue Growth Trend: Revenue grew from ₹3,043.42 million in FY24 to ₹4,569.71 million in FY26 (a 2-year CAGR of 22.53%). However, top-line performance had a dip of 8.55% in FY25 due to export order deferrals around the US election cycle before surging 64.18% in FY26 (bolstered by the consolidation of Yes Systems).
- Profitability & Margins: Net profit escalated dramatically from ₹202.51 million in FY24 to ₹837.89 million in FY26. PAT margin stood at 18.34% in FY26 (20.66% in FY25). This is supported by an EBITDA margin of 23.02% in FY26.
- Debt Dynamics: Total debt declined aggressively from ₹248.53 million in FY24 to ₹66.82 million in FY26. Debt-to-Equity is negligible at 0.03x, with a robust Interest Coverage Ratio of 32.56x.
- Operating Cash Flow: Consistently positive across all 3 years (₹732.50 million in FY26). Cash conversion remains stable relative to net income.
- Return Ratios: FY26 Return on Net Worth (RoNW) stands at 32.03% (32.72% in FY25), and Return on Capital Employed (ROCE) reached 43.01%.
- Working Capital Cycle: Net Working Capital days improved from 57 days in FY24 to 45 days in FY26. However, absolute gross trade receivables rose sharply to ₹1,089.62 million in FY26 (88 receivable days) alongside ₹359.56 million in total retention money locked with clients.
Glass Wall Systems (India) VALUATION & PEER COMPARISON
- Peer Comparison: The façade engineering solutions market in India is largely fragmented and unorganized, with no directly listed pure-play façade engineering EPC peers in India. Broad building-material/fenestration comparables (e.g., specialized architectural glass/fenestration processors and infrastructure EPC players) trade between 28x and 45x P/E.
- IPO Valuation Multiples:
- Earnings Per Share (FY26 Restated Diluted): ₹9.90.
- P/E at Lower Price Band (₹172): 17.37x
- P/E at Upper Price Band (₹182): 18.38x
- Post-Issue Price to Book (P/B): ~5.4x (based on FY26 post-issue NAV).
- Valuation Verdict: ATTRACTIVE. Asking for a P/E multiple of ~18.4x on FY26 earnings with >40% ROCE, >30% RoNW, strong operating cash flows, and single-digit debt offers reasonable margin of safety compared to broader engineering/building solution providers.
PROMOTER & MANAGEMENT ANALYSIS of Glass Wall Systems (India):
- Promoters: Jawahar Hariram Hemrajani (Chairman & Whole-Time Director) and Eshan Jawahar Hemrajani (MD & CEO), who possess more than two decades of domain experience in building façade engineering.
- Shareholding Profile:
- Pre-IPO Promoters & Promoter Group: Collectively hold 64.38% (Jawahar holds 37.42%, Eshan holds 15.11% directly/jointly).
- Post-IPO Promoter Holding: Dilutes to approximately 55.72%.
- Promoters Selling in OFS: Jawahar is divesting up to 2,530,243 shares; Eshan is offloading up to 2,740,431 shares. Combined promoter OFS represents ~5.27 million shares (~6.2% of pre-issue capital).
- Pledging: Zero promoter shares are pledged.
- Management Stability & Background Checks:
- The statutory auditor’s report noted that Jawahar Hariram Hemrajani and an Independent Director (Siddharth Bafna) rely on examination certificates/affidavits as original degree certificates were untraceable.
- Promoters have personal guarantees extended to external entities (M.J. Infrastructure Enterprises and M.J. Infotech Co.).
RISK FACTORS (TOP 10 CRITICAL RISKS):
- Client Concentration Risk: Top 10 clients contributed 86.40% of FY26 revenue from operations. The top 3 clients alone represent 56.75%. Loss of any of these key developer/contractor accounts would severely degrade profitability. (HIGH Severity)
- Heavy Single Manufacturing Facility Dependence: 100% of core manufacturing operations are concentrated at the Vile Bhagad facility in Raigad, Maharashtra. Any local disruption, industrial action, power breakdown, or natural disaster would bring total fabrication to a halt. (HIGH Severity)
- Absence of Long-Term Supplier Contracts: Raw materials (aluminium extrusions, silicone, performance glass) comprise 48.32% of operational revenue. No long-term pricing contracts exist, leaving the company exposed to commodity price inflation. (HIGH Severity)
- Litigated State Tax & Disputed VAT Liabilities: A contingent liability of ₹334.07 million is outstanding, including a ₹312.13 million Maharashtra VAT demand currently subject to high-court appeal/litigation by the department. This equals 12.77% of total FY26 net worth. (HIGH Severity)
- Project Execution & Retention Capital Locks: Total client retention money withheld under defect-liability clauses stands at ₹359.56 million (₹153.75 million non-current). Extended real estate timelines or customer insolvency could lock up or impair these cash flows. (MEDIUM Severity)
- Cyclical Real Estate Sector Correlation: The company is directly exposed to commercial and residential real estate construction cycles. A slowdown in developer capex or delays in project completions will directly hit contract awards. (MEDIUM Severity)
- Foreign Exchange & Geographic Export Exposure: 45.20% of FY26 revenues are derived from export markets (USA 40.04%, Australia 5.16%). Unhedged net foreign currency exposure stands at ₹615.09 million, exposing margins to FX swings and overseas trade barriers/tariffs. (MEDIUM Severity)
- Unregistered Brand Logo: While registered for specific trade names, the primary “Glass Wall Systems” logo application remains pending with the Trade Marks Registry. (MEDIUM Severity)
- Execution Risk on GPU Backward Integration: Capex of ₹50.00 crore is committed to an in-house glass processing unit without formal appraisal by banks/institutions; delay in statutory clearances or underutilization will burden fixed costs. (MEDIUM Severity)
- High Workforce Attrition: Employee attrition stood elevated at 27.03% in FY26. Inability to retain trained technical designers, façade engineers, and skilled fabrication labour could impact installation precision. (LOW-TO-MEDIUM Severity)
OFS & SHAREHOLDER ANALYSIS of Glass Wall Systems (India):
- OFS Proportion: 85.98% of the total public issue size is OFS.
- Selling Shareholders:
- Private Equity Investor: India Business Excellence Fund IIA (Motilal Oswal PE) is offloading 14,943,048 shares (WACA of ₹24.69 per share), securing a full/substantial institutional exit.
- Promoters: Jawahar Hariram Hemrajani (2,530,243 shares; WACA ₹3.57) and Eshan Jawahar Hemrajani (2,740,431 shares; WACA ₹62.77).
- Promoter Post-IPO Lock-in: 20% minimum promoter contribution is locked for 3 years, with excess pre-issue holding locked for 18 months per SEBI ICDR guidelines.
- Verdict: The OFS proportion (>50%) is a clear Caution Signal as the IPO serves primarily as an institutional liquidity and promoter profit-booking vehicle, rather than a large balance-sheet expansion. However, promoters still retain majority operational control (~55.7%) post-listing.
LITIGATION & LEGAL RISKS of Glass Wall Systems (India):
- Cases Against Company/Subsidiary: Zero criminal cases. Outstanding material civil/tax proceedings stand at 22 tax matters with an aggregate quantifiable exposure of ₹436.52 million.
- Significant Specific Cases:
- Maharashtra VAT Matter: ₹312.13 million demand concerning FY06–FY18. Although the Maharashtra Sales Tax Tribunal quashed the demand in May 2026, the department has filed a writ petition before the High Court in August 2026.
- GST Demands: Karnataka GST authorities have initiated Section 73 proceedings claiming ₹98.96 million across FY23–FY26.
- Cases Involving Promoters/Directors: Nil criminal proceedings, nil direct disciplinary actions by SEBI or stock exchanges.
- Overall Severity: Significant (due to the size of the tax demands relative to equity, though core operations remain free of criminal/fraud actions).
RELATED PARTY TRANSACTIONS:
- Key Transactions:
- Acquisition Consideration: Allotment of equity shares worth ₹1,549.95 million in FY26 to acquire 100% of Yes Systems Private Limited.
- Sub-contracting Services: Sub-contracting payments made to group entity MJ Coaters Private Limited totaling ₹206.04 million in FY26 (accounting for 38.59% of total sub-contracting charges).
- Managerial Remuneration: Remuneration paid to Jawahar Hemrajani (₹15.00 million) and Eshan Hemrajani (₹15.00 million) in FY26.
- Promoter Guarantees: Personal guarantees provided by promoters for credit facilities availed by external promoter-held firms (M.J. Infrastructure Enterprises and M.J. Infotech).
- Verdict: Sub-contracting dependency on promoter-affiliated entities (like MJ Coaters) is high, but the internal consolidation of Yes Systems reduces leakage. Overall, related party exposure is acceptable but warrants ongoing monitoring.
RED FLAG SCORECARD of Glass Wall Systems (India)
| Red Flag | Score (0–3) | Notes |
| High/Rising Debt | 0 | Negligible debt (D/E 0.03x; Total Debt ₹6.68 Cr). |
| Negative Operating Cash Flow | 0 | Consistently positive OCF (₹73.25 Cr in FY26). |
| High OFS Component (>50%) | 3 | OFS constitutes ~86% of the issue. |
| Promoters Selling Large Stake | 1 | Promoters selling ~6.2% stake; retain ~55.7% control. |
| Expensive Valuation vs Peers | 0 | Attractive at 18.38x FY26 P/E versus broader building plays. |
| Frequent/Serious Litigation | 2 | Contested tax/VAT litigation (~₹33.4 Cr contingent liabilities). |
| Related Party Concerns | 2 | Significant job-work routing via MJ Coaters (38.6% of job work). |
| Weak/Unproven Business Model | 0 | Proven execution track record (>150 projects, strong export base). |
| Loss-Making with No Profit Path | 0 | Profitable (FY26 PAT of ₹83.79 Cr). |
| Low Promoter Post-IPO Holding | 0 | Strong post-issue promoter ownership (~55.7%). |
Total Score: 8 / 30 — CAUTION
(Primary caution drivers stem from the heavy ~86% OFS structure, customer concentration, and ongoing high-value tax litigation).
FINAL VERDICT
✅ APPLY
Investment Thesis:
Glass Wall Systems represents a differentiated proxy play on India’s urban commercial infrastructure revival and green architectural transformation, alongside an established high-margin export footprint in the US and Australia. While the IPO is predominantly an Offer for Sale (~86%), the company’s financial profile is rock solid: near debt-free balance sheet (D/E 0.03x), strong return profile (ROCE 43.01%, RoNW 32.03%), consistent operating cash generation, and an active order book of ₹981.55 crore. At an upper price band of ₹182, the issue is priced at an attractive FY26 P/E of 18.38x, leaving ample valuation comfort for public market investors.
Key Reasons Supporting the Verdict:
- Comfortable Valuation: Priced at ~18.4x FY26 earnings with >18% net margins and >40% ROCE, leaving money on the table for investors.
- Balance Sheet Strength: Virtually debt-free with cash and bank balances exceeding total borrowings, backed by positive operating cash flows.
- Backward Integration Margin Driver: The ₹50 crore capex into in-house glass processing will capture margins historically lost to external glass suppliers (₹70 crore procured externally in FY26).
- Strong Export Revenue Diversification: 45.20% export contribution insulates the business from single-geography domestic real estate slowdowns.
Category Recommendation:
- For Short-Term to Long-Term (1–3+ Years): Favourable risk-reward profile to participate in premium real estate facade demand and structural margin expansion from backward integration. Also eligible for moderate listing gain opportunities given reasonable valuation pricing.
Key Risks to Watch Post-Listing:
- Real Estate Sector Slack: Any delay or liquidity crunch in top real estate developers causing receivable write-offs or retention money delays.
- High Court Ruling on Maharashtra VAT: Final judicial outcome of the ₹31.21 crore VAT challenge.
- Trade Tariffs: Any changes to US import duties on fabricated building materials that could impact overseas pricing competitiveness.
Disclaimer: The information provided on IPO Stack (https://ipostack.in) is for informational and educational purposes only and should not be considered financial, investment, or trading advice. While we strive to ensure that the information published on our website is accurate and up to date, IPO Stack does not guarantee the completeness, reliability, or accuracy of any information presented.



Pingback: Glass Wall Systems IPO GMP Today & Kanohar Electricals IPO GMP Today: Latest GMP, Subscription & Listing - Wealth CreatorzGlass Wall Systems IPO GMP Today & Kanohar Electricals IPO GMP Today: Latest GMP, Subscription & Listing